Thursday, December 8, 2011

Transactional and Management Capabilities

Transactional Capabilities: 
  • Expense Transactions 
  • Revenue Transactions 
Both of the above types rely upon the management capability to reference the master data system of record in transaction records.

Management Capability 
Referenced by the records created in the transaction capability.


Financial Management Capability
Offer Management Capability


Party Management Capability

Master Data
The relationship between both offer and party management with master data.


Master Data Management "the how"


Classification in an Enterprise and Business Architecture

Enterprise and Business Architecture Classification for a System Design


Travelers
In either direction you will have travelers

  • Expenses - Traveling South with your Suppliers
  • Revenue-Traveling North with your customers 
Continuing our highway analogy we intend to drill into the drivers and the vehicles make, model and colors as we build our performance measures the different types of combinations to guide decision making.

These are the level 2 values in any party management capability.  What's important about these variables.  These are generic and apply globally.  We have the management focus which relates to the create, read, update and archive capability for the PARTY roles internally and externally.  

Drivers
  • Worker Person Party
  • Worker Party Guest

Motor Vehicles
  • Organization Party
  • Customer Party
  • Supplier Party

Moving from Silo's to Systems


Management Capability
Plan the business and setup your legal liabilities for running the business services in a cloud and with prevent threats or contain those that may surface.


Transaction Capability
Run the Business or Operational requirements that derive their source for users, suppliers, customers and offers with financial ledger or chart of accounts assigned to the customers, suppliers, and offers by users from the system of record.  Generally ERP. 

The primary focus in Running the Business Services includes risk management for resilience and operational effectiveness.  This diagram inserts a logically grouping of process to functional data stores recording the outputs. 

Assume a top down flow of information and across the chevrons your CRUD process, with flat end chevrons representing your append of electronic records rather than duplicate.

Reference:  Automation

Design for New Business Models

An analogy
An analogy of a 3 lane highway anywhere in the world, we are not going to discuss the highway location, nor the travelers.


Entry and Exit
We will explain the points of entry and exit, the speed in which we would expect in each lane and how the two directions on any highway tell us. 
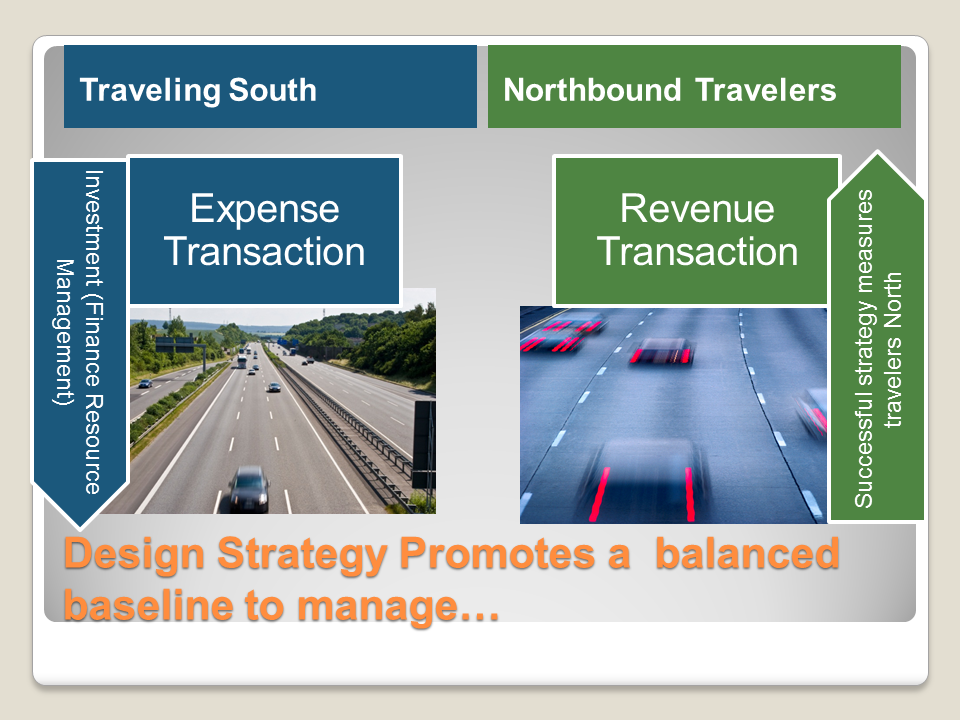


South
We can assume that our suppliers travel in one direction for the purpose of this analogy we will assume they are in our southbound direction on any of the three lanes. 


North
We can assume travelers Northbound on the highway are customers with the revenue outcome measured in any entering traveler.  We can assume the revenue was recognized at the exit of the traveler when exiting the highway. 

Three lanes
In either direction we can assume the traveler enters the highway in some motor vehicle.  We are not concerned about the make, model or color and even less concerned about the driver. 


In this analogy we simply know these details exist, which may influence the rate of speed the traveler moves in either North or South directions. 

As with any highway, we have a slow lane that all travelers enter the highway by merging into the slow lane.  As the traveler accelerates they may move into the middle lane and eventually the farthest lane to the left. 

Performance Measures
The performance of an organization can be derived by the number of travelers entering in one direction and how quickly they begin to measure the make and models entering in the North direction after exiting from the South bound direction.  We are assuming that south bound relates our suppliers with the build of an offer, exiting implies a customer can pick up the vehicle and travel North as they purchase the vehicle. 

Design Strategy
New Business Models
Any entrance and exit isn't restricted by the design, we are predicting the rate of speed the new business models will be traveling slower in the first lane before they are allowed to merge on to the middle or farthest left lane.  We suspect they will exit and enter frequently, therefore they will be best suited to travel in the first slow lane. 

Advanced Offers - Risk According to the Security Exchange Commission
The middle lane travelers who first enter, then accelerate and merge to the middle lane.  They may merge further left to the fast lane with the assumption that they will not impede the faster travelers. 
Assume this behavior or design pattern speaks to the way these offers ramp up and come back to get re-aligned several times before making it to the fast lane. 

The fast lane-Build Order Transfer models
In some cases the commuter lane, where the distribution model works with a partner to allow the fully sustained model. 

Capabilities
Basically our management capabilities and transaction capabilities are designed for the best and known design patterns.  Your organization should be measuring the performance against these criteria for external stakeholders.  In doing so you continue with your liberal approach to decision making. 

You quickly can recover in cases where you have over-corrected.  You are on your way to cloud services in this basic design and ready for new strategies every time.  No longer should you have to re-visit the enterprise or business architecture, rather the color, make and model investments are the scope of your future investments. 

Don't misunderstand, every road needs to be re-surfaced and new exit and entrances will be required.  However, the timelines of acquiring this activity no longer hinders your new business model.  Technology can be aligned to this model for faster and better services without customizations every time. 


Global Design Capabilities with outcome to performance and Business Service


Transaction Capabilities
  1. Expense Transactions
  2. Revenue Transactions


Graphic Design Patterns
Both of the above type(s) rely upon the management capability outputs as the source of information in a systems perspective of these two subjects.

Why systems?
The sole purpose of a customer party or offer intends to generate a transaction that produces revenue for an organization.  
For this reason, you must assume any use of the information subjects has a potential to change or influence the accuracy of financial transactions. 


Level 3 - North or South bound traffic simplifies the performance measures
  1. How does this contribute to the business opportunities?  
  2. By measuring ERP <inputs> and <outputs>  you eliminate many of the duplicate key controls. 
  3. <Publish> workflows consume to validate the action taken by the create management users. 
  4. Enables the segregation of duties for SOX 404 create transaction and create management validation.   
If volume metrics (quantified) determine risk;
  1. How do you qualify the severity without visual any of the transactions when defects are identified?  
  2. Doesn't this become a subjective determination?  

Moving from re-active to pro-active 

We want to eliminate the risk by ensuring the summary views are clean, connected and measured This approach eliminates a significant amount of waste. 
  1. If in-accurate; the validity becomes questionable and this can be a significant threat to any organizations brand or the source of failure for the financial integrity questioned by an investor. 
  2. If in-accurate; the completeness of the information may be influenced causing the information to report performance measures with bias.  The fox guarding the hen house

Technology solutions
The ability to break the systems components into sub-set information results in incomplete financial statements or requires offline processing that is harder to measure or subject to non-traditional measurement systems.


Process
The point here, if you are not using your 3rd party solutions (software) as designed you have the higher probability of in-efficient business process and over-production or process deviations with greater number of defects. 

People
In any case which forces human touches and/or the expectation rely on the diverse way humans translate a work activity helps to frame the higher defect probability.   This higher defect rate can be significantly reduced using he adjacent possibility concept.

Technology Presentation
The presentation in decision points of every workflow should prescribe the desired response as the default, allowing the user to take an explicit action to deviate.  I use three years of history to supply the option or variance.  Financial stakeholders will be comfortable with known actions as the acceptable variance.  The finally an exception path.

Key take away(s)
These are the primary threat and risk capabilities
  1. The only guarantee we have with human decision making; MUST Assume that we increase risk by every decision point. 
    1. A system view reduces key control threats.  
  2. Close activity introduces the control points.  
    1. If you have a high concentration of adjustments; you increase your threats by another human touch at each decision point.  

Copyright 2011 Lisa Marie Martinez